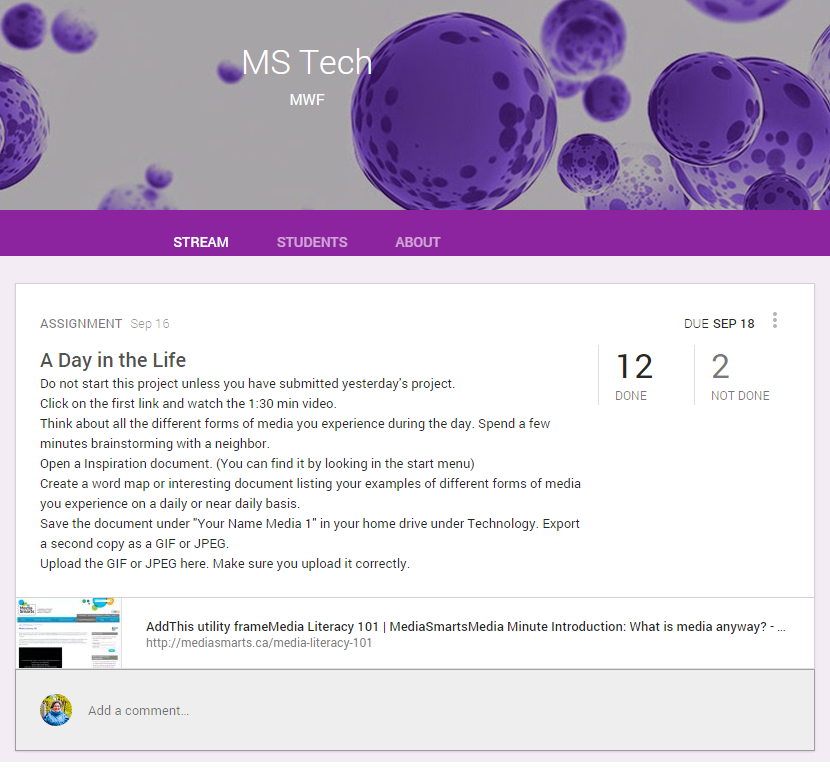
 The middle school students are now retrieving and submitting their technology work via Google Classroom. We would like to expand our use of Google Classroom (G.C.) but are “piloting” it for now with excellent results. Besides the simple Excel tutorials we have been doing, we have also done a project using Inspiration – software we have on all computers at school. The part of the G. C. that I like is that I can give all the links and directions for the students and they can have a written record to refer to during class or after school if they are completing or making up an assignment. Students are learning the best ways to save documents and how to upload them correctly and even resubmit as necessary. We have also talked about their email accounts as well as how, when and why to use their Google Calendar. We have been enjoying getting to know the G.C. platform and look forward to finding ways to expand its versatility and usefulness. 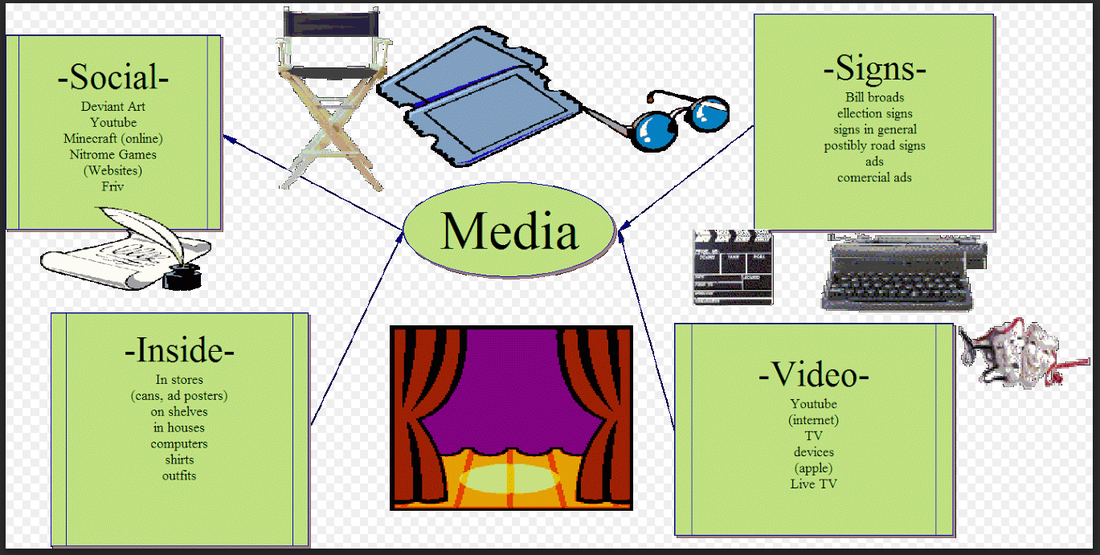
0 Comments
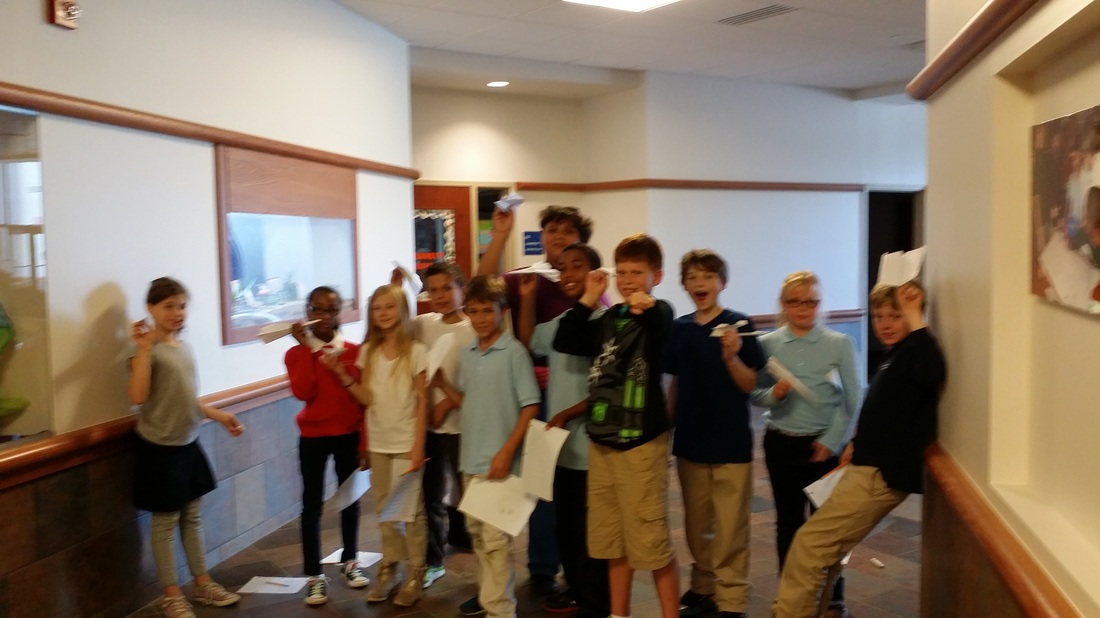
The 4th and 5th grade students are continuing our unit on working with Excel. To shake it up a bit we started with a mini lesson on research last week – and students researched “best paper airplanes”. On Tuesday, students brought in their paper airplanes and each student flew their plane 2 times, counting the best distance of both. We measured and recorded our data. Students then converted the data – recorded in yards and inches – to all inches. They learned the calculator function for this! Then after data was entered into the spreadsheet they created a bar graph. Finally, they worked on saving the spreadsheet to the proper drive and also saving the document as a pdf. They learned a lot and had a great time in the process! 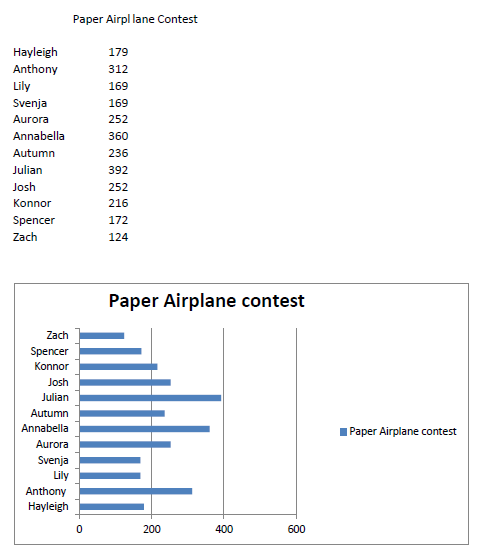
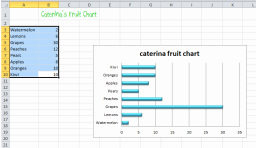 This week the 3rd graders worked on entering data on an Excel Spreadsheet and then creating a chart to represent the data. We built on some basic Microsoft lessons from last week of learning vocabulary and functions of ribbons and buttons on Office products. Students have been working on step by step directions for inserting titles in the correct column and row and how to merge and center and change font and color. Then the students entered the data and are learning how to highlight specific cells to get the needed data included in the charts. We created a bar graph and a pie graph. Most students are still working on how to change the colors of the specific pie wedges of the pie graph when we wrapped up our Friday lesson. Some students were even prepared to learn how to save their data as a PDF as well. 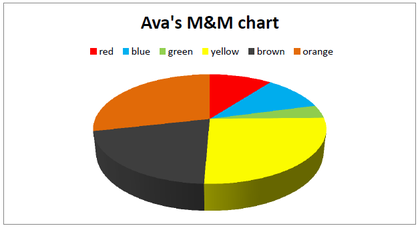
|
AuthorI'm Mrs. G the tech teacher and I hope to share some of the integrated activities we are working on in the lab. Categories
All
 
Archives
October 2015
|
 RSS Feed
