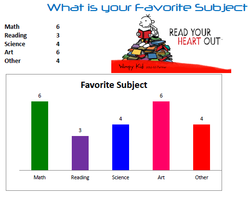
 Student began with taking a survey with their class and the 6th graders asking for every one's favorite school subject. They recorded their data on a tally chart.
Then they started using their knowledge they already have to create an excel document and save it correctly in the proper place. We used a bar graph to show the data and talked about how to name the chart and the axis if they chose a chart that included that. Then they learned how to search a picture that represented their favorite subject and capture it to put on their document. Finally, they did a final save as a pdf. I am so excited to see their skills growing and so many are bringing me in charts and graphs that they are making at home using what we have learned in class!
0 Comments
Leave a Reply. |
AuthorI'm Mrs. G the tech teacher and I hope to share some of the integrated activities we are working on in the lab. Categories
All
 
Archives
October 2015
|
 RSS Feed
